Research Designs - Part 2
Factorial Experimental Designs Factorial designs are used when you have two or more IVs and want to know if an interaction is present. If we add another IV to design (7) so we have two IVs, then we have what is called a factorial design. We also have a more complex diagram. Suppose we add sex as an IV to the study in (7). Thus the IV, sex, would have two categories: male and female. A study with two IVs needs to have at least four groups. For design (9), we will have 4 groups and we will choose not to have the control group.
RA
EVENT               1        2
------------------------------------
Group  1            X1A      O
Group  2            X1B      O                             (9)
Group  3            X2A      O
Group  4            X2B      O
------------------------------------
The groups are composed thus:
Group 1 is composed of (1) men receiving (A) individual counseling
Group 2 is composed of (1) men receiving (B) group counseling
Group 3 is composed of (2) women receiving (A) individual counseling
Group 4 is composed of (2) women receiving (B) group counseling
If we decided we needed a control, we would have to add two control groups, one group of men and one of women. It is often easier to understand how the variables interact to form the groups if a grid diagram is used. Study the example below to understand how the two IVs (factors) are combined and result in four groups, where each group receives a different combination of IV categories.
                        ---------------------------------
                                  IV - Factor B
                                Type of Counseling
                        ---------------------------------
                         (A) Individual  (B) Group
 --------------------------------------------------------
     IV     (1) Men    Group 1 (X1A)   Group 2 (X1B)
  Factor A ---------------------------------------------
     Sex    (2) Women  Group 3 (X2A)   Group 4 (X2B)
 --------------------------------------------------------
This design also leads to a more complicated set of directional hypotheses than the single IV studies. This study, and all other two factor designs, have three directional hypotheses:
Interaction means that there is one combination of Factor A and Factor B that produces a bigger difference than another combination. For example, perhaps women do better with group therapy, and men do better with individual therapy.
Time Series Designs Time series designs are the third category of experimental designs. A time series design differs from an experimental design in purpose. With an experimental design we are interested in outcomes, thus we usually only observe behavior after all treatments are done. With a time series design we are interested in process, and observe behavior during treatment, i.e., or more correctly after each individual treatment.
An example of a time series study is when we want to see how well a diabetic patient can regulate their glucose level. To keep their glucose levels stable diabetic patients use insulin every day. To see if they maintain a stable glucose level we need to measure the level each day. A time series study is different from a repeated measures design in that they will have more observations (ten or more is typical), and the observations are taken more often (hourly, or daily).
Time series designs are also called single subject designs, because these designs were first used with studies that used only one subject. Single subject designs are an extension of the classical medical case study. The single subject design is very useful with patients, since it parallels the data gathering one does when treating a patient. Data from several patients can be combined to obtain a more valid measure of the effect of the IV on the DV. You need many subjects because a sample size of one is not a reliable measure of the patient population you are studying, i.e. it will not generalize. In design (10) we have no control group, so we use the subject as his own control.
EVENT      1   2   3   4
-----------------------------
Group 1   O1   X  O2  O3                                (10)
(Subject)
-----------------------------
         <-a-> <-- B> <-a->
Since time series designs usually have numerous observations, it is best to abbreviate each phase on the diagram. Thus, in design (10) observation O1, which establishes a baseline for the subject's behavior, represents a series of observations not just one. Treatment X and observation O2 are a series recording the effect of each treatment on behavior. Finally, observation O3 is a series that records if the behavioral changes are maintained after the treatment is stopped.
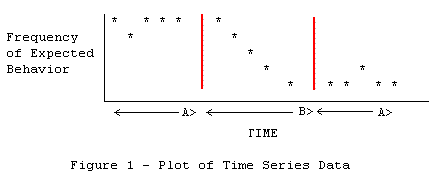
In a time series design the IV becomes the phases, e.g., in design (10) the IV has two categories: 1) time during which no treatment was given, and 2) time during which treatment was given. Thus, we expect the subject's behavior to change (or be different) due to the conditions of treatment/no treatment. Another way to diagram a time series design is in the form of a graph of the expected observations. Such a graph is shown in Figure 1.

There are three directional hypotheses with design (10) as shown in Figure 1:
Since the subject serves as his own control, hypotheses 2 and 3 cannot be tested unless hypothesis 1 is true. The first A phase is the control phase and if it is not stable there is no place to measure changes in the subsequent phases
A time series study can have several subjects and several groups. The groups in design (11) are the same that we had in design (8), but now the concern is to study the effect of each treatment on the subjects rather than just assessing the "after treatment" effects.
RA
EVENT      1     2     3
-----------------------------
Group  1   O     X1    O                                 (11)
Group  2   O     X2    O
Group  3   O           O
-----------------------------
         <--a--><----- B>
Time series studies have their own special terminology. Each time interval is called a trial, and trials without treatments are called phase A and trials with treatments are called phase B. Thus, the design in (10) is called an ABA design and (11) is called an AB design.
You use the ABA design with behavioral interventions where the patients behavior might deteriorate when the treatment is stopped. The second baseline (A) period lets you check if behavior is maintained after treatment is stopped. Use the AB design for rehabilitation interventions where recovery is not dependent on the continuance of therapy. You can have many different designs, for example: ABAB, or ABACA (where C is a different treatment). Always have a baseline (A) period as the first period because the baseline serves as the control from which further changes are evaluated.
Relationships research questions are the final category of research questions. These are questions that concern prediction, i.e., can we predict variable X from variable Y? A relationships question would be: Is the relationship between diet and heart disease strong enough that we can predict the onset of heart disease from a knowledge of diet? This type of research question leads to correlation/regression designs. Correlation/regression designs are ex post facto designs because while we may define IVs we do not manipulate them. We do not manipulate the IV because we gather all the data at one time, hence there is no time to manipulate the IV. These designs are similar to observational studies except that we hypothesize a correlation between variables, rather than simple descriptions.
A correlation describes how as one variable changes (the IV) another variable also changes (the DV) in a (hopefully) predictable way. For example as the temperature rises in a room, we become less comfortable. Thus temperature and comfort are correlated. Regression is a mathematical equation that lets you actually make predictions and the correlation value tells you how accurate your predictions are).
With correlational designs we may have many variables, but we observe them all once, and at one time, see design (12).
R
EVENT        1
-------------------                                          (12)
Group  1     O
-------------------
Assume that in design (12) we are studying three variables: exercise level (V1), age (V2), and health care costs (V3). We select a random sample of people, gather data on each variable from each person, and then correlate the data. We will obtain three measures of relationship: V1 with V2, V2 with V3, and V1 with V3.
We may find that exercise level decreases with age, that health care costs increase with age, and that health care costs increase as exercise level decreases. This does not tell us that decreased exercise level causes health care costs to increase. In order to prove that one variable causes another to change we must do a factorial experimental study where we vary exercise level and control for age. A correlational study does not prove causality (that A causes B), it just describes how variables relate to each other. We usually use correlational studies to find important variables, that we later study using differences designs to establish causality.
The data for a correlational study looks like this:
         Subject     Variable 1      Variable 2     etc.
        -------------------------------------------------
            1           00.0            00.0        00.0
            2           00.0            00.0        00.0
            .            .               .            .
            :            :               :            :
            N           00.0            00.0        00.0
        -------------------------------------------------
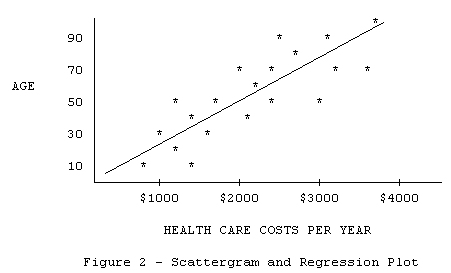
Correlational studies give a picture of the relationships between variables. A plot of hypothetical data for age and health care costs appears in Figure 2. Each * in the plot represents the scores for one subject on each variable.

The plot indicates as age increases, annual health care costs also increase. The straight line is called a regression line. The line describes the "best prediction" of variable Y (Age) from variable X (Health Care Costs). In this particular case the prediction is not very accurate because the actual scores (the *'s) do not lie on the line. There are some older people who have low health care costs. The correlation tells the researcher the strength of the relationships between variables, and the accuracy of prediction, i. e., If I know how much you spend on health care, how accurately can I predict your age?.
When is a study relationships and when is it differences? A differences study has one or more of the following characteristics: 1) a manipulated IV, 2) two or more groups, 3) two or more observations, and /or 4) a directional hypothesis of this form, "The IV will cause the DV to change. A directional hypothesis for a relationships study has this form, "The IV and the DV are related, and the IV will predict the DV."
Another type of correlation design occurs when you are measuring the reliability of a test. To measure reliability you administer the test twice under exactly the same conditions. Design (14) illustrates a reliability design.
R
EVENT       1      2
-------------------------                             (13)
Group  1    O      O
-------------------------
Detailed discussions of all the above research designs can be found in Kerlinger (1973), Cox and West (1986), and other books on research design. Associated with each design are appropriate statistical methods for analyzing the data.
There are many more experimental designs, but all designs are just logical diagrams of events and groups. Remember first develop your hypotheses, then plan your study to test them. Your study need not conform to these examples to be correct.